User Guides
A personalized guide to understanding the accessibility data and transforming into power.

A User Guide to Translate Data into Power
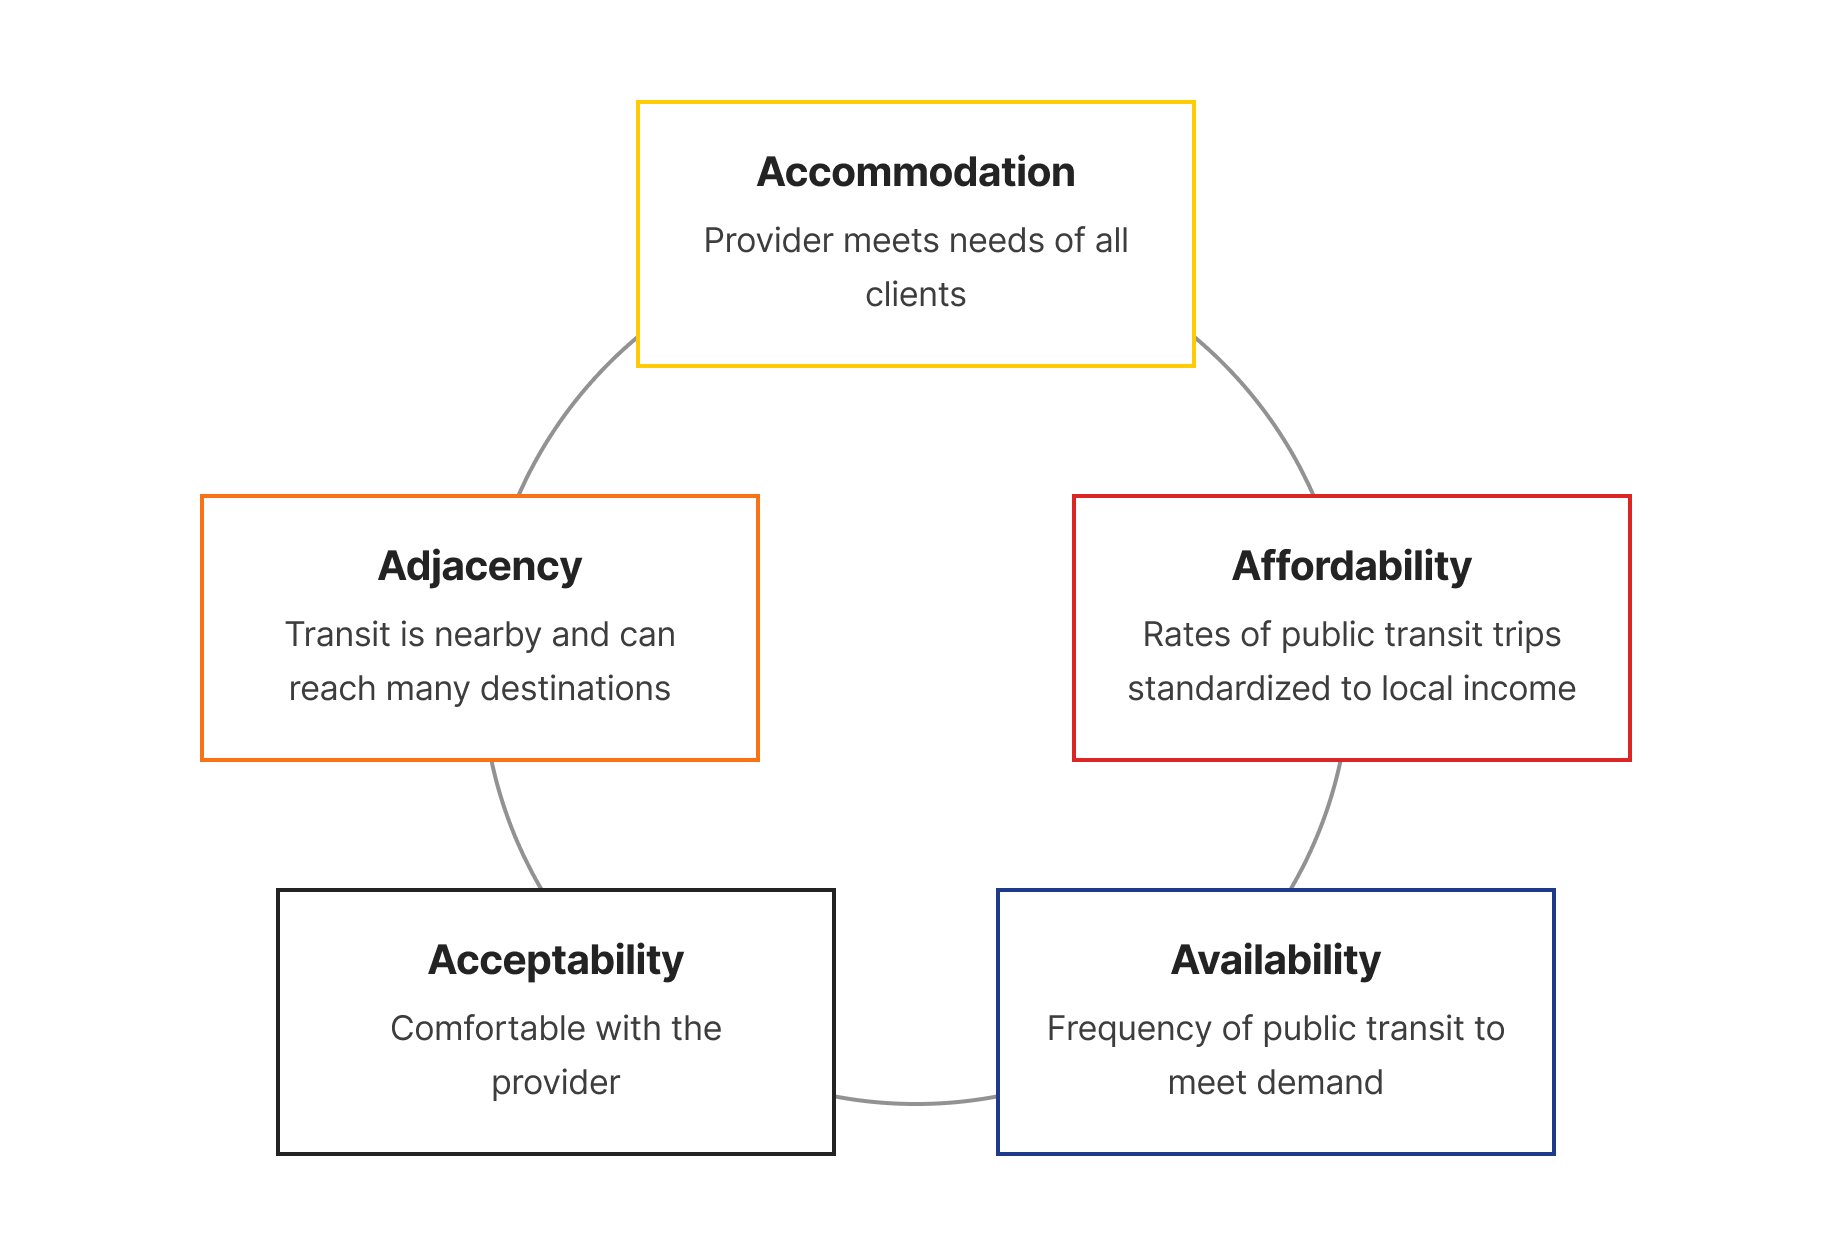
The Public Transit Disability Dashboard aims to evaluate the accessibility of public transit systems in the U.S. based on five components: (1) Accommodation, (2) Adjacency, (3) Availability, (4) Affordability, (5) Acceptability
![A circle featuring the five dimensions of public transit accessibility: [clockwise, starting at 12:00] Accommodation: Provider meets needs of all clients; Affordability: Average fare per trip; Availability: Frequency of public transit to meet demand; Acceptability: Comfortable with the provider; & Adjacency: Transit is nearby and can reach many destinations.](https://cdn.sanity.io/images/zluhtbpy/production/a5af8a00882d8d8333e8ab3a2af337578c252680-1832x1256.png/a-circle-featuring-the-five-dimensions-of-public-transit-accessibility-clockwise-starting-at-12-00-accommodation-provider-meets-needs-of-all-clients-affordability-average-fare-per-trip-availability-frequency-of-public-transit-to-meet-demand-acceptability-comfortable-with-the-provider-adjacency-transit-is-nearby-and-can-reach-many-destinations..png)
This user guide was developed to support community members, researchers, public transit system agencies, and policymakers. Within this guide we will show you how to use the dashboard information to improve the accessibility of public transit services. For specific questions related to how different components of accessibility are measured, please refer to the Methods section.
Roadmap for Transit Equity: Understanding and Using Accessibility Data
This section of the guide breaks down the essential components of accessible public transit. By exploring these “stops” you will move from understanding the barriers to leveraging data for system change.
Stops
Transit offers a way for people to reach destinations and connects them to resources and opportunities. Although there are many modes of transit, most people in the United States are drivers. There are varied reasons individuals prefer to drive, including length of travel, convenience, and associated feelings of independence. Viewed from a different perspective, though, people in the U.S. often have no choice but to drive because of the limited accessibility of other modes of transit such as public transit.
Poor accessibility of public transit services is a major systematic issue as not everyone can benefit from using public transit. There are many important benefits of public transit such as:
- Playing a vitally important role in how people move in their communities
- Making us healthier by increasing physical activity and social participation
- Reducing the risk of chronic conditions like cardiovascular issues, dementia, and depression
However, the benefits of public transit use are not universally accessible because they are designed for people who are economically secure, white, and non-disabled. The detrimental effects of a non-inclusive design can be observed through the differences in reachable destinations by public transit for each group.
The prevalent accessibility gaps in public transit are unacceptable as they are federally funded services that must be compliant with Title II Americans with Disabilities Act (ADA) and Section 504 of the Rehabilitation Act of 1973. This user guide aims to empower and unite everyone in the fight against transportation injustice.
What does the accommodation data show?
The measure captures how well public transit systems communicate their accessibility features on their websites. While it is, of course, important that public transit systems have these features, it is equally imperative to clearly state the accommodations they provide and regularly update their sites if the services are not available (because of maintenance, for instance).These communications help public transit users plan their trips in advance.
Each public transit system is scored and ranked according to a standardized evaluation system. As of the most recent data collection year (2025), the results indicate that no public transit system has received a perfect score in accommodation.
What do the rankings mean? The rankings are relative and indicate how well a public transit system is communicating its accessibility features in relation to other evaluated public transit systems.
Should I use rankings or scores? Both can be meaningful depending on what is needed. Rankings may be useful in quickly comparing public transit systems while scores can illuminate the specific areas in which public transit systems are performing well or still need to work on, making it impactful to monitor progress over time. However, it is instrumental to understand what the numbers mean and contextualize the rankings to the scores. Please refer to the Methods page for more information on how the scores were developed.
What does the data show?
The adjacency measure captures how many destinations older adults with disabilities can reach within 30 minutes. Although public transit riders are diverse in age and disability status, public transit systems should help all riders, including those who may have different mobility needs or slower walking speeds, access meaningful places in a reasonable time.
Are there adjacency scores for individual public transit systems? No, an important distinction from the accommodation measure is that the adjacency measure is not specific to a public transit system. Because the adjacency measure recognizes that riders may commute using multiple public transit systems, it evaluates adjacent transit systems simultaneously instead. For further details, please refer to the Methods page.
What does the data show?
The availability measure is scored as an average wait time for a bus at each stop within a census tract. An important note is that this data only reflects scheduled frequency; delays and temporary detours are not taken into consideration. For further details, please refer to the Methods page.
What does the data show?
The affordability measure shows the average fare per trip. It is calculated two ways: (1) across all modes offered by the transit system, and (2) for demand response only. Demand response most commonly includes paratransit trips but may also include taxi cab services or other on-demand transit options. See the Methods page for details.
Every single measure is important to understand the accessibility of public transit. If even one component of access is not met, then the public transit system is not accessible. The composite measure provides a score to compare accessibility for older adults with disabilities across public transit systems by aggregating all the currently available components of access together. It is scored from 0 to 100, with a higher score representing a more accessible transit system. For further details, please refer to the Methods page.
Shape our public transit access with choice
This dashboard is intentionally publicly available to welcome diverse users, not only to interact with the different measures of accessibility regarding public transit but also to interact with each other in choiceful collaborations that expand public transit accessibility. This section of the guide aims to provide tailored recommendations to community members, researchers, public transit system agencies, and policymakers on how to optimize use of the dashboard and offer guidance to collaborate. We encourage user groups to read through all the sections to understand how everyone can work together.
Your Role in the Movement
Transforming public transit systems is a collective effort. Explore the roles below to discover how you can leverage this dashboard to champion a more inclusive, equitable transit system for everyone.
You play a critical role in shaping transit access through vocalizing your lived experiences and standing in unity to advocate for a universally accessible public transit system. Your voices are impactful and can be further amplified with the support of the findings from the dashboard. This dashboard aims to democratize data on public transit accessibility so that you all have ownership of the information and inform yourselves on the disparities of public transit access.
For example, this dashboard can answer your questions such as:
- Accommodation:
- Is the public transit system I live nearest or use most frequently accommodating the needs of the riders?
- Which of the top 100 federally funded public transit systems are accommodating their riders the best/the worst in relation to each other?
- Adjacency:
- Is there a public transit system near me?
- How many destinations can I reach walking within my area of residence? Riding public transit? What if I have a disability?
- Availability:
- On average, how often does the public transit system(s) near me arrive at the stop?
- Affordability:
- How much does it cost on average to use the public transit system?
If there are questions you would like answered that you do not see represented here, please email us at [email protected].
The answers to the above questions can be found [instructions and screenshots, Postponed]
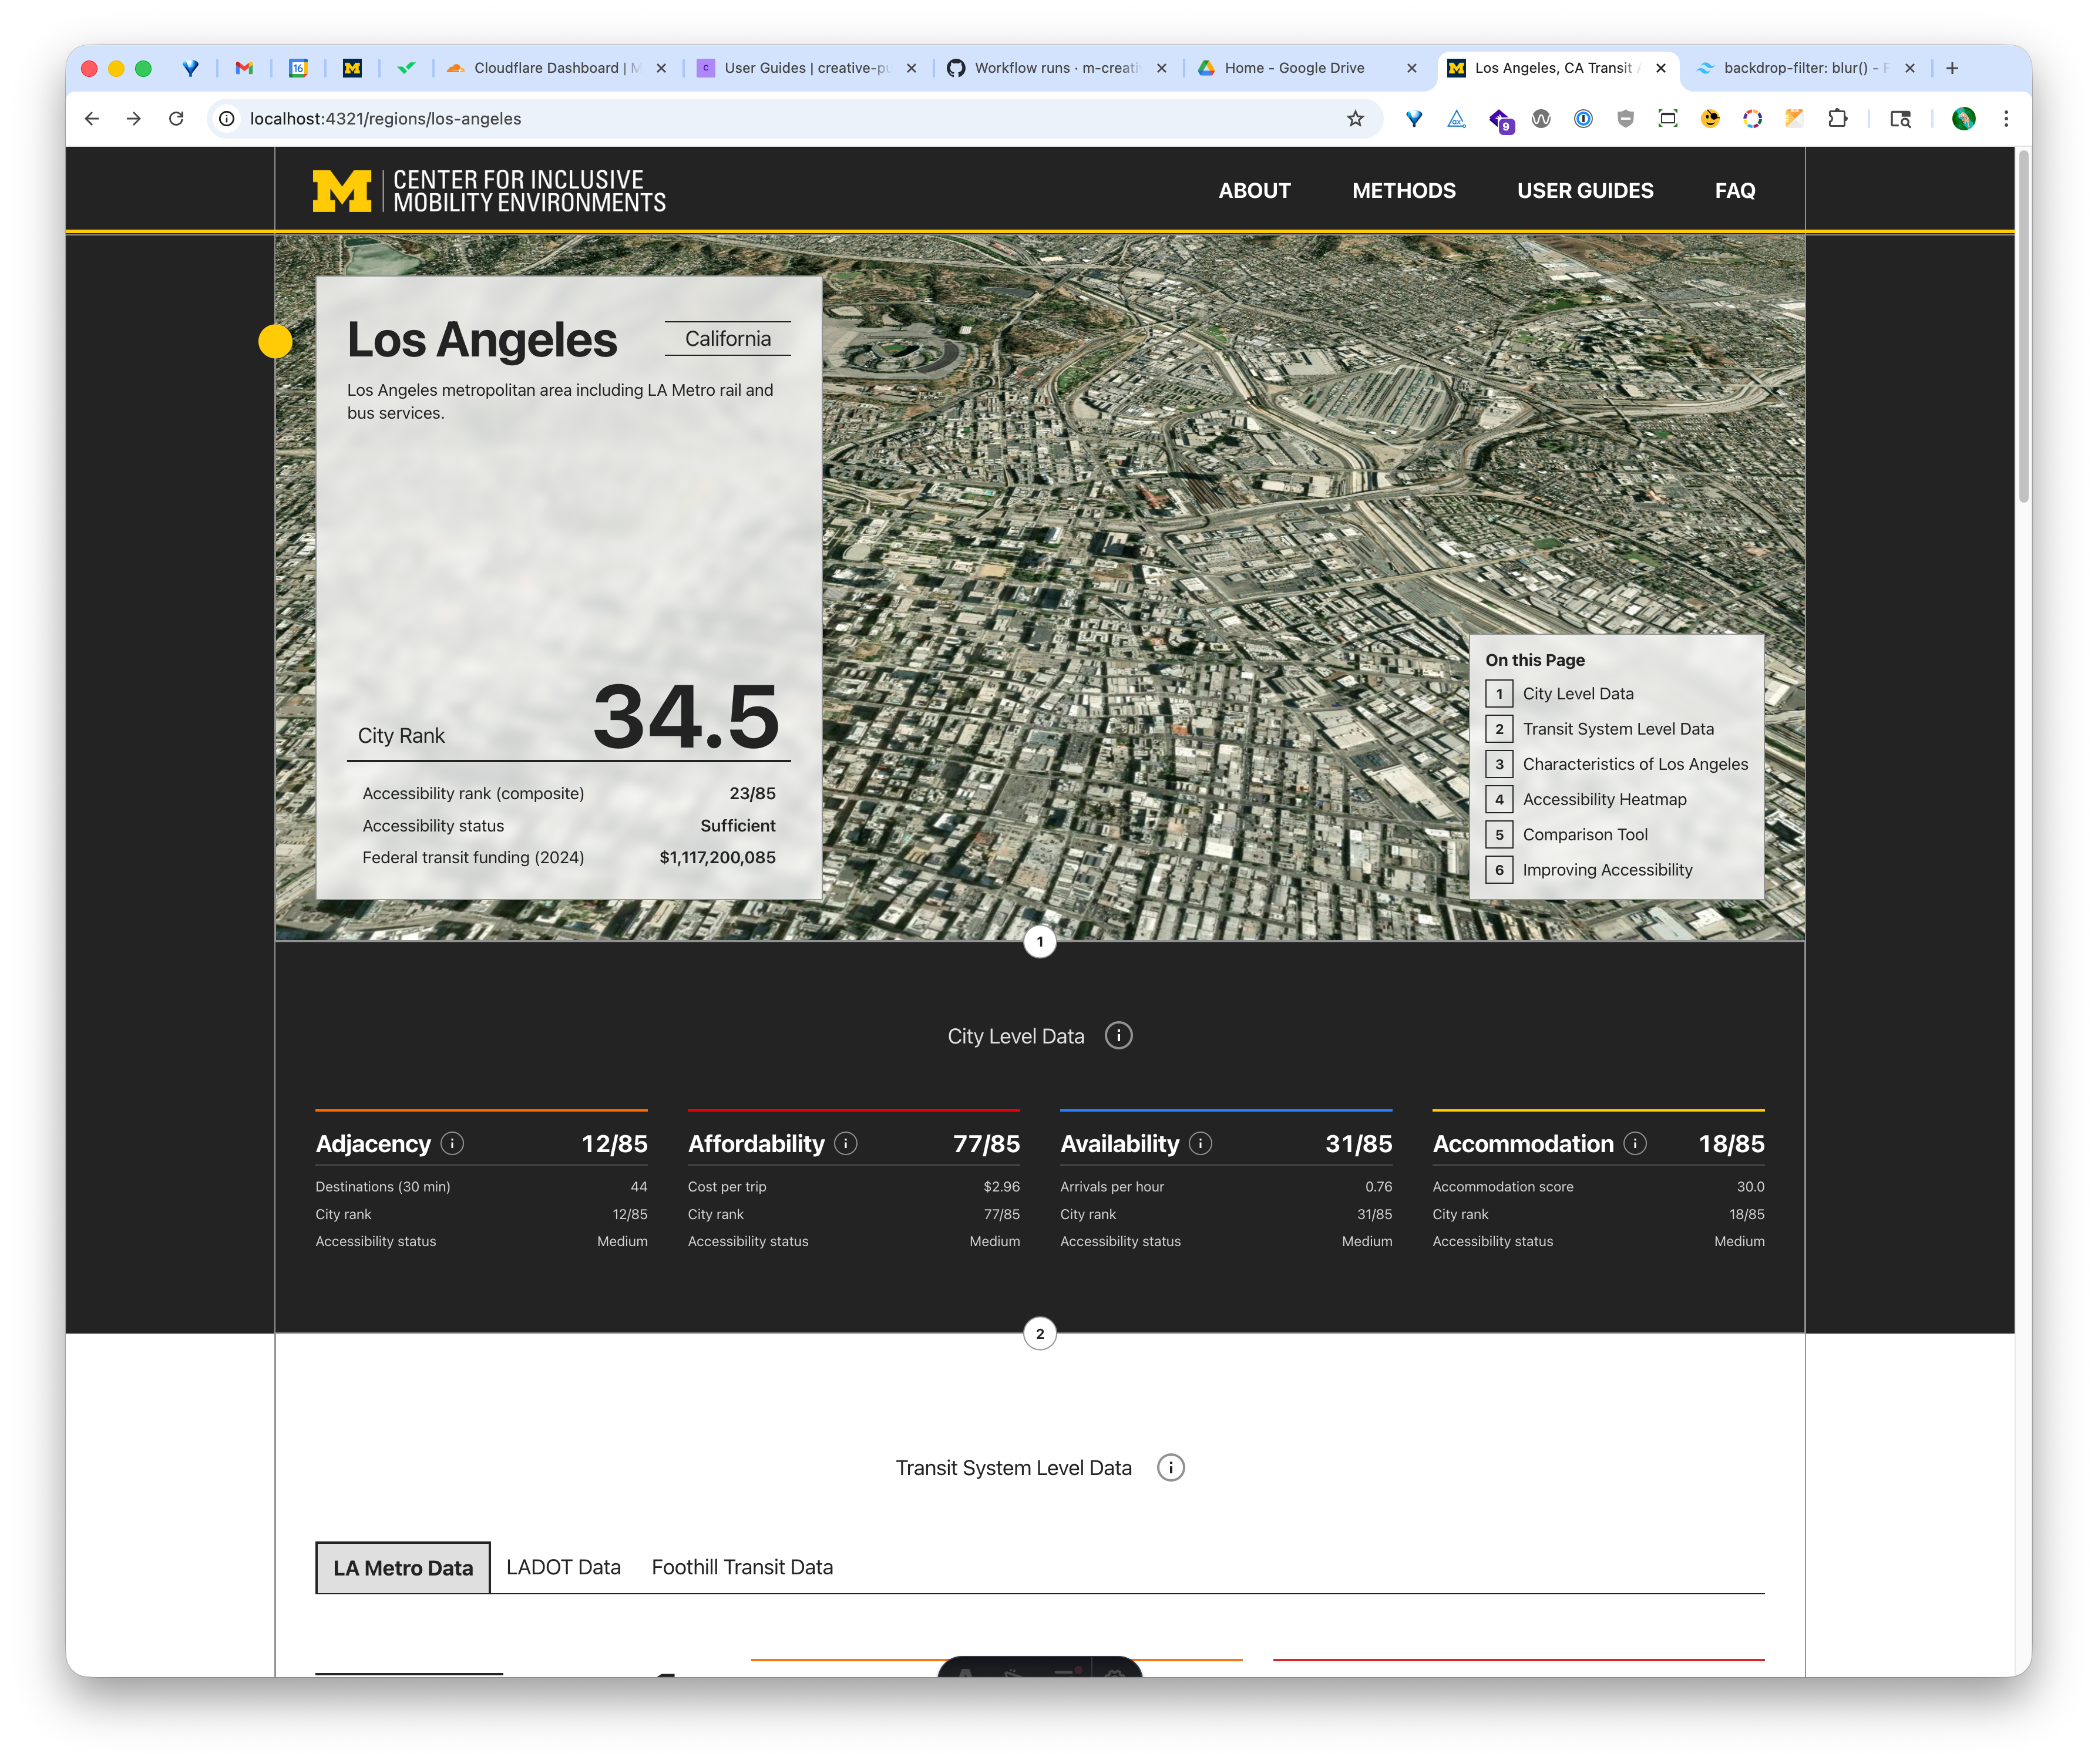
How can the data be translated into power?
The answers to these questions can help you understand the impact of the local public transit system (or lack thereof) in your community and provide insight on the accommodation level of your local public transit system. They can help identify the greatest needs in your community and provide direction for your advocacy.
However, the dashboard has two critical limitations that only you as the community members can overcome. The dashboard does not provide information on what each local community member needs from public transit systems and what their lived experience using public transit is like.
We recommend that each local community organize together to 1) identify communal needs and critical areas in which public transit systems should change and 2) provide direction for researchers in what data they should collect or use to capture lived experiences accurately. When organizing, everyone must be invited to participate in the conversation.
What an inclusive invitation looks like
Effective community organizing requires that community members are all informed equitably about the opportunity to participate.
Here are some quick items to consider when organizing a community meeting:
- Sharing the information in different formats such as print, email, calls, and braille
- Informing everyone in advance so that people can prepare and make arrangements as needed
- Ensuring the venue or remote meeting room is accessible and providing information about accessible features to everyone
- Asking everyone interested in attending if they have access needs so that arrangements can be made in advance
- Providing an agenda in advance, which can provide clarity about meeting expectations and guide community members on potential topics to raise during the meeting
Invitation is the start. During the community meetings, there must be a norm that everyone’s voices matter and participation can be in varied forms. It is by including everyone that we can ensure public transit systems are accommodating everyone.
What happens after the meeting
Advocacy is most effective when it is collective. Building a strong, connected community first creates the flexibility and mutual support needed to take action; when one person cannot show up, others can carry the effort forward. There are many important spaces where your voices are greatly valued and need to be heard. Here are some ideas on where to focus or diversify your advocacy:
- Grassroots Organizing
- Build power within your community through inclusive campaigns that center the needs of all riders. Consider joining or forming cross-issue coalitions with other advocacy groups. Shared goals around transportation, housing, and healthcare access can broaden your reach and strengthen your collective voice.
- Converse with public transit system representatives when they hold forums
- Public transit agency leaders need to understand where their services need improvement. Attend public forums hosted by your local transit authority, come prepared with specific examples of accessibility gaps, and work with agency representatives to identify practical steps toward more accessible service.
- Advocate at your next local government meeting
- Your attendance and engagement at town hall meetings, city council sessions, or public budget hearings can draw attention to the transit challenges your community faces and connect your advocacy to ongoing funding and policy efforts. To find the right meeting, start by visiting your city or county government’s website for a public meeting calendar, or contact your local elected official’s office to ask where transit issues are most often discussed.
- Share your expertise as an advisory board member to a research group
- Researchers who want to make an impact greatly value understanding the needs of the community so they can produce ethical research that can provide evidence for community advocacy.
You play a critical role in advancing transit accessibility by generating evidence, evaluating systems, and identifying structural disparities in public transportation.
How can the data be transformed into power?
This dashboard brings together accessible data on public transit accessibility to support comparison across systems and analysis over time. By making this information easier to access and use, the dashboard helps researchers identify inequities, evaluate interventions, and generate insights that contribute to the academic literature, inform policy decisions, and support more equitable public transit systems.
For example, this dashboard can answer your questions such as:
- Accommodation:
- How do accommodation features vary across federally funded public transit systems?
- Adjacency:
- How does adjacency vary across regions?
- Availability:
- How does availability vary across transit systems?
- Affordability:
- How does the cost of fares vary across public transit systems and between fixed and demand-response routes?
If there are questions that you would like answered and do not see represented here, please email us at [email protected].
The answers to the above questions can be found [instructions and screenshots, Postponed]
How researchers can use the dashboard
The dashboard includes interactive visualizations, comparison tools, and downloadable data, enabling researchers to conduct transparent, reproducible analyses at the system and national levels. These features support exploratory and policy-relevant research while making public transit accessibility data easier to access and use.
Here are some examples of how the dashboard can support your research:
- Conduct comparative analysis
- Researchers can compare accessibility across different transportation systems to examine differences by system characteristics and region, while also identifying imbalances across the four accessibility domains within individual systems.
- Evaluate interventions and policies
- Researchers can examine how changes in policy, funding decisions, or service interventions align with changes in public transit accessibility over time.
- Identify inequities and structural patterns
- Researchers can use the dashboard to surface patterns of unequal access across regions and transit systems and examine how these patterns relate to broader inequities in transportation planning and investment.
- Complement qualitative and community-engaged research
- Researchers can use the dashboard to add context to qualitative findings, choose locations for interviews or fieldwork, and connect lived experiences with system-level accessibility data. It can also serve as a starting point for deeper, community-engaged research that captures barriers not visible in quantitative data alone.
- Empower the next generation of research leaders
- The dashboard can be used as a teaching tool in transportation, urban planning, public policy, and public health courses. Students can engage with real-world data to explore accessibility concepts, conduct comparative analyses, and develop applied research skills.
You play a critical role in shaping transit access through the accommodations and types of public transportation services (e.g., paratransit, buses, rails, ferries) you provide, routes available, costs of fares, and frequency of your services.
How can the data be transformed into power?
The dashboard can be utilized to inform decision-making that improves transit access. For example, the information can be used to increase the number and quality of the accommodations provided or improve comprehensiveness of the routes to expand the number of destinations reached with public transit.
Some questions that may interest you can be answered using the dashboard:
- Accommodation:
- How well is your public transit system accommodating your riders relative to other public transit systems?
- Adjacency:
- How many destinations can your riders reach with your public transit system and neighboring public transit systems?
- Availability:
- Assuming vehicles are not delayed, how frequently are your vehicles arriving at a designated stop?
- Affordability:
- Are your fares affordable when considering the local income?
If there are any questions you would like answered that are not represented here, please email us at [email protected].
The answers to the above questions can be found [instructions and screenshots, Postponed]
The answers provided through the dashboard aim to shed light on the accessibility of your public transit systems to improve ridership and mobile autonomy. However, there are limitations with our dashboard regarding insight on particular access needs contextualized to each local community. This information can be answered in discussions with community members, researchers, and policymakers.
Collaborating with community members
Sharing decision-making power with community members is crucial to making public transit access equitable. However, (INSERT %) of public transit agencies audited in our data collection have made decisions about public transit planning with community members. There are a considerable number of public transit agencies that could use guidance in how to work with community members in future decision-making.
Here are some recommendations:
- Invite community members to gather their feedback
- Many public transit agencies audited often had routine council meetings or invited community members to listen in on the meetings. However, the important distinction here is that community members are not here just to listen but also to give invaluable feedback and participate actively in their local public transit systems.
- It is crucial that the invitation is inclusive of a diverse community group such as older adults and people with disabilities. To have an inclusive community meeting requires that the invitation itself is universally accessible in different formats (e.g. braille, print, call, email), sent in advance to allow community members to prepare, and scheduled at a day and time that would encourage high turnout. The meeting venue should be accessible and have accessible features disclosed transparently. The invitation should also offer ways for community members to share their access needs, and meeting organizers should follow through on providing these accommodations.
- Continue transparently communicating to demonstrate follow-through on action items
- The meeting is not the end of the discussion. The feedback provided during the meeting must be taken seriously and implemented, requiring public transit agencies to follow up with not only the attendees but the whole community about what was discussed during the meeting as well as next steps and timelines.
- Community members should know when and where to expect communication. Transparent and consistent communication builds trust!
- Set up a recurring meeting with community members
- One community meeting does not suffice! Having routine meetings with community members allows them to not only raise concerns and broach innovative ideas but also build rapport to advocate for more funding to be allocated toward accessible features and their maintenance.
Collaborating with researchers and policymakers
Similar to collaborative meetings with community members, discussions with researchers and policymakers also require inclusive and consistently transparent communication to build trusting partnerships. However, there may be a different focus.
- Partnering with researchers can look like an information exchange in that public transit systems can provide researchers with rich data on their services while researchers can analyze the data and transform it into meaningful recommendations on expanding accessibility.
- Differently, partnerships with policymakers can lead to greater funding dedicated to expanding accessibility of public transit services and meeting transportation needs for community members, potentially leading to improving community health (i.e., mental, physical, and social).
It is important to remember that while partnerships with researchers and policymakers are important, the community members must be actively part of the decision-making process. As a collective, these meetings have the power to transform access to public transit.
You play a critical role in shaping transit access through enforcing anti-discrimination laws such as the Americans with Disabilities Act and Section 504 of the Rehabilitation Act, which cement the rights of people with disabilities to access federal services, including public transit.
How can the data be transformed into power?
The data from the dashboard can be leveraged in advocacy work. For example, the dashboard shares the findings from routine evaluations on the accommodation levels of public transit systems. Such information can be utilized to monitor progress and hold public transit agencies accountable.
Some questions that may interest you can be answered using the dashboard:
- Accommodation:
- How accommodating are public transit systems to their riders?
- Adjacency:
- Are residents in your jurisdiction able to reach important destinations in a reasonable amount of time?
- Availability:
- How frequently are riders able to use public transit services?
- Affordability:
- How affordable is public transit for riders considering the local income levels in your jurisdiction?
If there are questions that you would like answered and do not see represented here, please email us at [email protected].
The answers to the above questions can be found [instructions and screenshots, Postponed]
The answers to the questions can help visualize transit access in your jurisdictions and across the U.S. Your expertise in policy landscape and infrastructure are needed to alleviate the inequities of public transit access.
Here are some recommendations to optimize the findings from the dashboard:
- Understand what accommodations look like for the public transit systems in your jurisdiction and track them over time, with the intention to monitor progress or stagnation.
- Meet with community members, researchers, and public transit system agencies independently.
- Meeting with community members is critical to understand their perceptions of public transit and overall experiences of using public transit. Furthermore, they can share their access needs and provide insight into their visions of accessible public transit. However, it is crucial to ensure everyone is encouraged to participate in these meetings, requiring an invitation provided in multiple formats, an accessible meeting venue, and sufficient time for everyone to make arrangements and vocalize their access needs for the meetings.
- Meeting with researchers who study public transportation can provide in-depth understanding of public transit use trends, accessibility gaps, and barriers to address these accessibility gaps. They also can share their recommendations on what needs to change based on their research findings.
- Meeting with public transit system agencies may provide perspective on their difficulties in providing accommodations. These insights are instrumental to creating effective strategies to address these roadblocks and implementing universal design in public transit systems.
- Set up recurring meetings to monitor progress with both public transit system agencies and community members.
- Communicate transparently and consistently about these progress updates with the community.
- Such communication practices not only build rapport but also demonstrate that everyone has ownership in creating an accessible public transit system.
- Meet with community members, researchers, and public transit system agencies independently.
- Understand which geographic areas in your jurisdiction have high and low adjacency to recognize disparities.
- Visit geographic areas with high and low adjacency and meet with community members there to understand why an area has high and low adjacency.
- Gathering insight through observations and conversations with local community members provides layered understanding. Local community members may highlight the highly contextualized differences for which the dashboard may have limited data. It is important to gather diverse community perspectives about their mobility needs.
- Raise these points in meetings with public transit system agencies and community members to see how innovative solutions could address the disparities.
- Visit geographic areas with high and low adjacency and meet with community members there to understand why an area has high and low adjacency.
Your power to translate data into policy change is impactful and must be done in unified collaboration with community members, public transit system agencies, and researchers.